Über EHDO
EHDO ist ein kostenloses Webtool, welches die Struktur von Energieversorgungssystemen optimiert. Das Tool wurde vom Lehrstuhl für Gebäude- und Raumklimatechnik der RWTH Aachen University entwickelt. Das Tool wurde mit dem Ziel entwickelt, die akademische Lehre im Master-Studiengang Energietechnik an der RWTH Aachen weiter zu verbessern.
Fördermittel: Die Entwicklung des Webtools wurde bislang weder durch eine Institution noch ein privates Unternehmen gefördert.
![]() Das Tool nutzt als Berechnungsmethodik ein mathematisches Optimierungsmodell (gemischt-ganzzahliges lineares Programm). Wir danken Gurobi für die Bereitstellung einer Gurobi-Lizenz für dieses Tool. Professionelle numerische Löser, wie Gurobi, ermöglichen komplexe mathematische Optimierungsmodelle in kurzer Zeit zu lösen. Wir verweisen an dieser Stelle gerne auf das Take-Gurobi-With-You Programm für Studienabsolventen.
Das Tool nutzt als Berechnungsmethodik ein mathematisches Optimierungsmodell (gemischt-ganzzahliges lineares Programm). Wir danken Gurobi für die Bereitstellung einer Gurobi-Lizenz für dieses Tool. Professionelle numerische Löser, wie Gurobi, ermöglichen komplexe mathematische Optimierungsmodelle in kurzer Zeit zu lösen. Wir verweisen an dieser Stelle gerne auf das Take-Gurobi-With-You Programm für Studienabsolventen.
Github Repository
Der Code des Optimierungsmodells ist open-source und kann hier eingesehen werden: Github Repository
Publikationen
Das EHDO Webtool wurde in folgenden Publikationen vorgestellt:
EHDO: A free and open-source webtool for designing and optimizing multi-energy systems based on MILP. M. Wirtz, P. Remmen, D. Müller. Computer Applications in Engineering Education, 2020. https://onlinelibrary.wiley.com/doi/10.1002/cae.22352 [DOI: 10.1002/cae.22352, Open Access]
About EHDO
EHDO is a free webtool that determines and optimizes the configuration of energy supply systems. The tool was developed by the Institute for Energy Efficient Buildings and Indoor Climate at RWTH Aachen University. The primary purpose of this tool is to support academic teaching in the master program Energy Engineering at RWTH Aachen University.
Funding: The development of this webtool was not funded by any institution or company.
![]() The tool uses a mathematical optimization model (so called mixed-integer linear program) in the backend.
We gratefully thank Gurobi for supporting this non-commercial tool with a free Gurobi license. Professional numeric solvers, like Gurobi, are able to solve complex mathematical optimization models very time-efficient. We kindly refer to their Take-Gurobi-With-You program for graduating students.
The tool uses a mathematical optimization model (so called mixed-integer linear program) in the backend.
We gratefully thank Gurobi for supporting this non-commercial tool with a free Gurobi license. Professional numeric solvers, like Gurobi, are able to solve complex mathematical optimization models very time-efficient. We kindly refer to their Take-Gurobi-With-You program for graduating students.
Github Repository
The code of the optimization model is open-source and can be viewed here: Github Repository
Publications
The EHDO webtool has been presented in the following publications:
EHDO: A free and open-source webtool for designing and optimizing multi-energy systems based on MILP. M. Wirtz, P. Remmen, D. Müller. Computer Applications in Engineering Education, 2020. https://onlinelibrary.wiley.com/doi/10.1002/cae.22352 [DOI: 10.1002/cae.22352, Open Access]
Tool Beschreibung
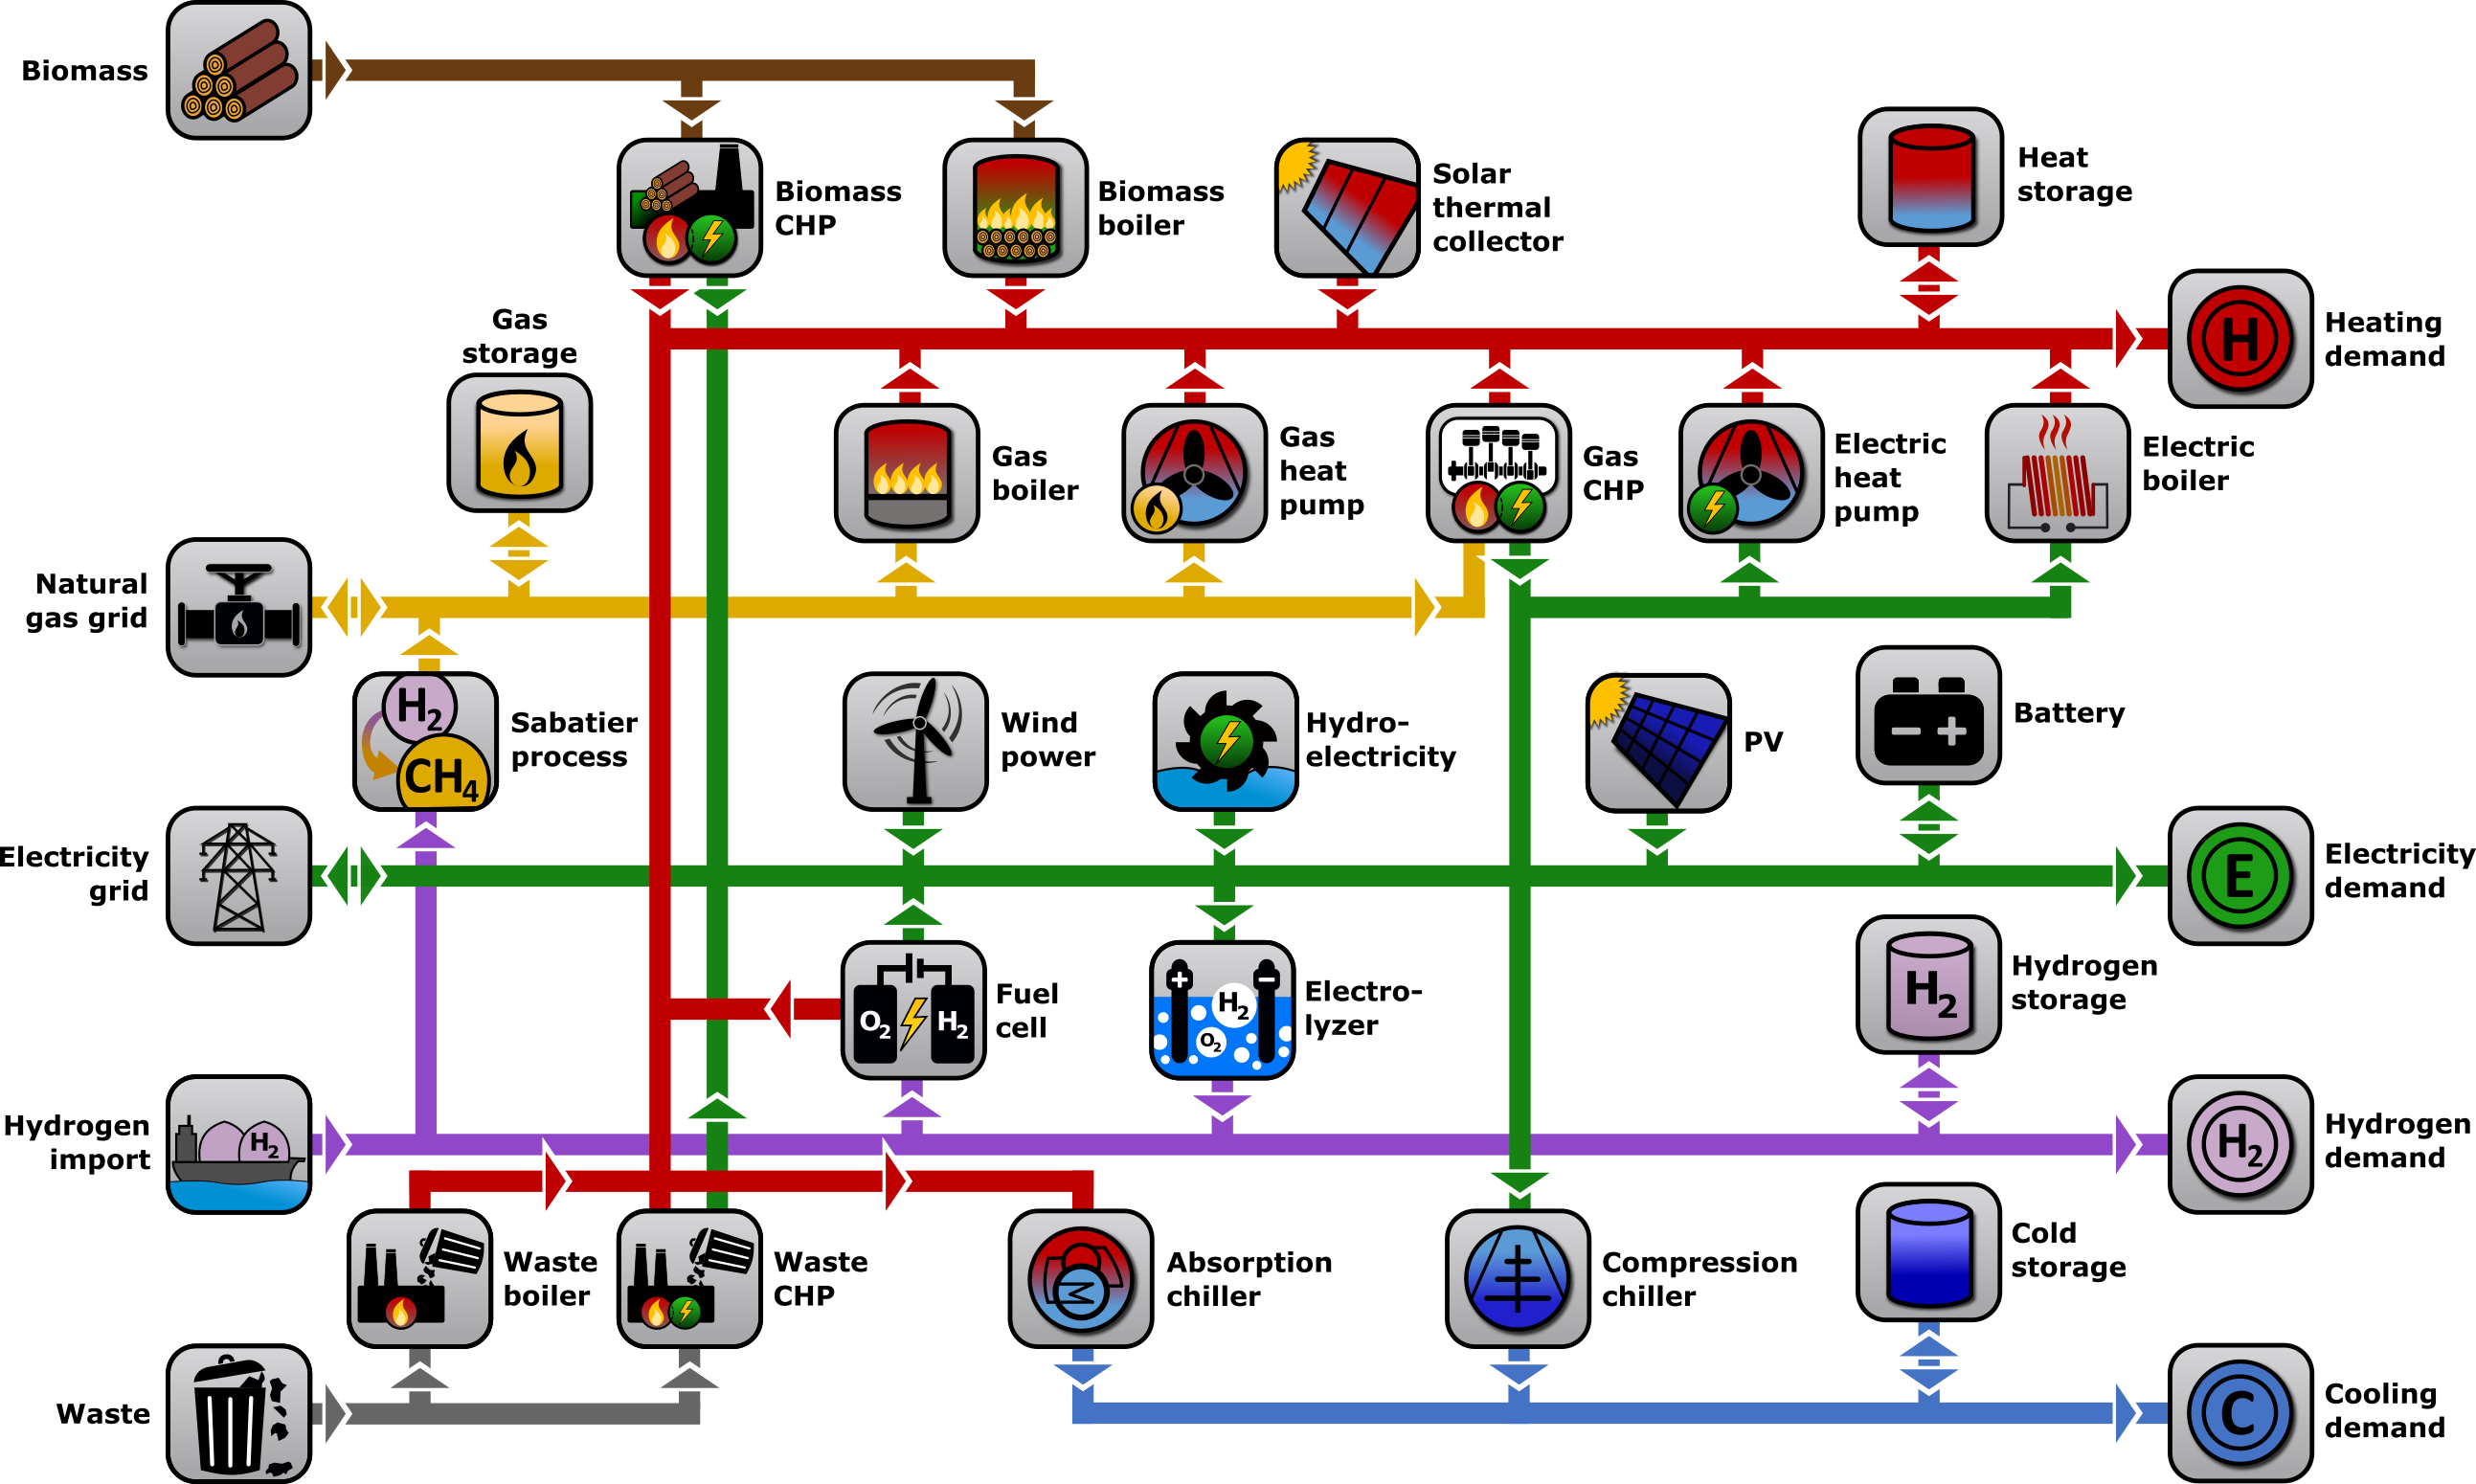
Das EHDO Tool ermittelt aus einer großen Menge von möglichen Energieversorgungssystemen die kosten- oder emissionsoptimale Systemkonfiguration. Die Berechnung des optimalen Systems wird mittels eines mathematischen Optimierungsmodells berechnet. Alle Modelparameter und Randbedingungen können vom Benutzer beliebig verändert werden. Dies macht EHDO zu einem sehr flexibel einsetzbaren Tool. EHDO wurde für die akademische Lehre an der RWTH Aachen University entwickelt: Studierende erlernen wie optimale Energieversorgungssysteme mit einer hohen Durchdringung von erneuerbaren Energien und sektorenübergreifenden Energiespeichern optimal ausgelegt werden und wie Energieträger wie Wasserstoff in Energiesystemen der Zukunft eingesetzt werden können. Das Berechnungsmodell bedient sich vereinfachenden physikalischen Annahmen, welche technische Details vernachlässigen, die für die Planung eines realen Energiesystems von Bedeutung sein können. So werden beispielsweise keine Temperaturniveaus betrachtet. Dies bedeutet, dass alle Energieflüsse, welche in der Abbildung unten dargestellt sind, uneingeschränkt möglich sind und Temperaturniveaus der Wärme- und Kälteströme nicht berücksichtigt werden. Im Modell werden außerdem keine thermischen Verluste (außer bei thermischen Speichern), hydraulische Druckverluste in Rohren oder Verluste oder Leistungsbeschränkungen im elektrischen Netz betrachtet. Bitte beachten Sie außerdem den Haftungsausschluss.
Das EHDO Tool umfasst eine Eingabeseite mit drei Eingabereitern und eine Ergebnisseite. Auf der Eingabeseite werden der geografische Ort des Systems, die zu deckenden Energiebedarfe, sowie technische und ökonomische Parameter für den jeweiligen Anwendungsfall definiert. Die voreingestellten Parameterwerte basieren auf dem deutschen Energiemarkt. Die berechnete optimale Energiesystemkonfiguration ist auf der Ergebnisseite dargestellt. Detaillierte Informationen zur Systemperformance können als Excel-Datei für weitergehende Analysen heruntergeladen werden.
Alle Eingabeparameter sowie die Ergebniswerte werden unten auf dieser Seite detaillierter erläutert. Die Struktur des Optimierungsmodells mit allen im Tool verfügbaren Technologien ist der folgenden Abbildungen zu entnehmen:
Tool description
EHDO is a tool to find an optimal energy supply system from a large set of possible system configurations. The optimal system configuration is calculated by a mathematical optimization model. All model parameters can be changed by the user. This makes EHDO a very flexible and widely applicable tool. EHDO has been developed for academic teaching at RWTH Aachen University: Students learn how optimal configurations of energy supply systems with high renewable penetration look like, how energy storage are sized and how energy carrier like hydrogen can be employed in future energy systems in an optimal way. The tool uses a simplified physical model which does not include all technical details needed to plan an energy supply system for a real-world use case. For example, temperature levels are not taken into account. This means that all energy flows depicted in the model scheme below are possible regardless of the temperature levels of heat and cold flows. The model does not take into account any thermal losses (except for thermal storages), hydraulic losses in pipes or any losses or limitations in the electricity grid. Please also note the disclaimer.
The EHDO tool comprises an input page with three tabs and a result page. On the input page, the location of the site, energy demands, technical and economical parameters are entered by the user. Default values are based on German market conditions. The optimal energy supply system is presented on the result page. Detailed performance data can be downloaded as Excel file for further analysis.
All input parameters as well as the results are explained on this page in more detail. The model structure with all available technologies is shown in the following illustration:
Demands & Location
Energy demands
The user has three different options to enter the heating demand: Firstly, the user can use example demands, which are based on data of an urban district with 100 buildings in Germany. This option is only meant for testing. Secondly, the user can enter a constant heating demand. This demand is then assumed constant throughout the year. Finally, the user can upload a heating demand time series as a .txt-file. The format of the data can be seen from the example file. The demand data must comprise data for every hour of the year which results in 8760 lines.
The user has three different options to enter the cooling demand: Firstly, the user can use example demands, which are based on data of an urban district with 100 buildings in Germany. This option is only meant for testing. Secondly, the user can enter a constant cooling demand. This demand is then assumed constant throughout the year. Finally, the user can upload a cooling demand time series as a .txt-file. The format of the data can be seen from the example file. The demand data must comprise data for every hour of the year which results in 8760 lines.
The user has three different options to enter the electricity demand: Firstly, the user can use example demands, which are based on data of an urban district with 100 buildings in Germany. This option is only meant for testing. Secondly, the user can enter a constant electricity demand. This demand is then assumed constant throughout the year. Finally, the user can upload an electricity demand time series as a .txt-file. The format of the data can be seen from the example file. The demand data must comprise data for every hour of the year which results in 8760 lines.
The user has three different options to enter the hydrogen demand: Firstly, the user can use example demands, which are based on data of an urban district with 100 buildings in Germany. This option is only meant for testing. Secondly, the user can enter a constant hydrogen demand. This demand is then assumed constant throughout the year. Finally, the user can upload a hydrogen demand time series as a .txt-file. The format of the data can be seen from the example file. The demand data must comprise data for every hour of the year which results in 8760 lines.
Location
Every calculation uses weather data as an input. Weather data affects the potential of renewable sources and the performance of air-source heat pumps. The user can select default weather data from a large number of cities around the world. The weather data is based on EnergyPlus-weather data sets. The data contains ambient air temperature, global horizontal irradiance (GHI) and wind speed data in hourly resolution. Alternatively, the user can upload his own time series. Example files are provided for better orientation. The upload file must contain 8760 lines (for each hour of the year). The uploaded data overwrites the default data of the selected location.
Technologies
Renewable energies
Photovoltaic modules convert solar radiation (sunlight) into electric power according to their module efficiency. In this model we assume that the radiation equals the global horizontal irradiance provided by weather data. This is not exact since normally the PV installations have a pitch angle. The efficiency is assumed constant and does not depend on the ambient air temperature. The investment (EUR/kWp) refers to the electric power capacity of the photovoltaic installation. In addition, the user can enter the lifetime of the PV modules (usually 20 years) and operation and maintenance costs as a percentage of the investment.
A wind turbine converts the kinetic energy of wind into electric power. The Hellmann coefficient is used to calculate the wind speed on hub height of the wind turbine. This is important since wind speeds are usually measured near ground at a reference height. Both, hub height and reference height are entered by the user. It is advisable to check the full load hours of the wind turbines in order to double check these parameters, especially the Hellmann coefficient as, in practice, it is difficult to estimate. If the full load hours are unrealistically large, the Hellmann coefficient should be decreased. The investment refers to the total electric power capacity that can be installed. In addition, the user can enter the lifetime of the wind turbines and operation and maintenance costs as a percentage of the investment.
Water turbines convert kinetic energy of falling or fast-running water into electric power. The user can enter a generation potential which is assumed constant over the year. This generation potential can be produced throughout the year. However, the turbine can be bypassed and the dispatch of the power generation is calculated within the optimization. The investment refers to the electric power capacity of the hydropower plant. In addition, the user can enter the lifetime and operation and maintenance costs as a percentage of the investment.
A solar thermal collector converts solar radiation (sunlight) into usable heat with a defined thermal efficiency. The efficiency is assumed constant and does depend on the ambient air temperature. The investment refers to the heat generation capacity of the solar thermal collector. In addition, the user can enter the lifetime of the solar thermal collectors and operation and maintenance costs as a percentage of the investment.
Heating & cooling technologies
A heat pump moves thermal energy from a cold heat source to a warmer heat sink. The heat pump COP is either defined by the user (Use constant COP), or calculated based on the Carnot efficiency. If the Carnot efficiency is used, the user needs to enter a heating and cooling supply temperature. In addition, the user can upload a COP time series as a .txt-file. The format of the data can be seen from the example file For cost calculations, specific investments for heat pumps can be defined.
An electric boiler converts electricity to heat with a defined thermal efficiency, that is usually close to 1. The investment refers to the heating capacity of the electric boiler. In addition, the user can enter the lifetime of the electric boiler and operation and maintenance costs as a percentage of the investment.
A compression chiller converts electricity into cooling power. The COP (ratio of cooling power to electric power) defines the efficiency of the chiller and is assumed constant throughout the year. The investment refers to the cooling capacity of the compression chiller. In addition, the user can enter the lifetime of the compression chiller and operation and maintenance costs as a percentage of the investment.
An absorption chiller converts high-temperature heat into cooling power. The thermal efficiency defines the ratio of cooling power to the driving heating power. The investment refers to the cooling capacity of the absorption chiller. In addition, the user can enter the lifetime of the absorption chiller and the operation and maintenance costs as a percentage of the investment.
Natural gas technologies
A CHP (combined heat and power) unit converts natural gas into electric power and useful heat considering a thermal and electric efficiency. The investment refers to the rated electric power of the CHP unit. In addition, the user can enter the lifetime and operation and maintenance costs as a percentage of the investment.
A gas boiler converts natural gas to heat with a defined thermal efficiency. The investment refers to the heating capacity of the gas boiler. In addition, the user can enter the lifetime of the gas boiler and operation and maintenance costs as a percentage of the investment.
A gas heat pump transfers thermal energy from a cold heat source to a warmer heat sink. Natural gas is used to fire the engine that drives the compressor. The coefficient of performance defines the efficiency of the gas heat pump and is assumed constant throughout the year. For cost calculations, specific investments for heat pumps can be defined. In addition, the user can enter the lifetime of the gas heat pumps and operation and maintenance costs as a percentage of the investment.
Biomass technologies
A biomass CHP unit converts biomass into electric power and heat considering a thermal and electric efficiency. The investment refers to the electric power capacity of the biomass CHP unit.
A biomass boiler converts biomass to heat with a defined thermal efficiency. The investment refers to the thermal heating capacity of the biomass boiler.
A waste CHP unit converts waste into electric power and heat considering a thermal and electric efficiency. The investment refers to the electric power capacity of the waste CHP unit.
A waste boiler converts waste to heat with a defined thermal efficiency. The investment refers to the thermal heating capacity of the waste boiler.
Hydrogen technologies
In an electrolyzer electricity causes a chemical reaction to produce hydrogen with a defined electric efficency. The investment refers to the hydrogen generation capacity.
A fuel cell converts hydrogen into electric power and useful heat considering a thermal and electric efficiency. The investment refers to the electric power capacity of the fuel cell.
Hydrogen can be stored in the hydrogen storage. The capacity of the storage refers to the effective usable capacity in kWh. Storage losses over time are neglected.
The Sabatier process describes the reaction of carbon dioxide and hydrogen to methane and water with a specific conversion efficiency. The investment refers to the generation capacity of natural gas per hour.
Energy storages
Surplus heat, e.g. from the CHP unit or boiler can be stored in the heat storage. A temperature range can be defined which describes the difference between temperature of an empty storage and temperature of a fully charged storage. Charging or discharging losses are neglected. Heat losses (i.e. storage losses) are considered as a share of the state of charge. For example, 1 %/h means that after one hour the stored thermal energy decreased by 1 %. The investment is given in EUR/m3 and refers to the storage volume.
Surplus cold, e.g. from the compression chiller or absorption chiller, can be stored in the cold storage. A temperature range can be defined as in the heat storage. Charging or discharging losses are neglected. Storage losses are considered as a proportion of the state of charge (as in the heat storage).
Surplus electricity, e.g. from the CHP unit or PV installation, can be stored in the battery. The capacity of the battery refers to the effective usable capacity in kWh (no minimum or maximum state of charge is considered). Storage losses over time are neglected.
Natural gas can be stored in the gas storage. The capacity of the gas storage refers to the effective usable capacity in kWh. Storage losses over time are neglected.
Model parameters
Energy costs
In this section, natural gas price for purchasing gas from the gas grid and an electricity price for the electricity drawn from the grid can be defined. It can be specified if electricity feed-in is allowed. If yes, surplus electricity from the CHP unit or PV installation can be fed into the public electricity grid. In this case, a feed-in tariff for electricity must be defined. If feed-in is not allowed, all generated power, e.g. by PV installations, must be used in the system. Curtailment of renewable energies is possible.
Ecological impact
In order to calculate the ecological impact of the system, specific CO2 emissions for burning natural gas and for the electricity mix (CO2 emissions power grid) can be defined.
Optimization
In this section, the user can define parameters of the optimization: For example, the optimization focus affects the weight of ecological and economic goals in the optimization. The user can define the interest rate and project lifetime which affects the annualization of investments. By using the design day clustering the accuracy of the optimization can be improved. The higher the number of design days the more precise the demand data is used in the optimization. In the optimization it is ensured that the installed generation capacities are equal to the peak demands of the year. The user can decide to consider renewable energies for covering peak demandsas well. This may lead to a less conservative energy system design.
Reference scenario
By using the reference scenario the costs and carbon dioxide savings of the optimized energy hub system can be compared to a conventional state-of-the-art-system. Instead of using a gas boiler which is connected to the natural gas grid, a heat pump with a defined heat pump COP can be considered. This heat pump is connected to the electricity grid. Furthermore the compression chiller COP can be entered by the user. If consider CHP unit is checked, electricity demands are primarily covered by a CHP unit. If heat from CHP exceeds the heat demand, the CHP unit operates at lower load and may not cover all electricity demands. In this case, additional power is drawn from the electricity grid.